Statistical Tool For Easy Data Visualization and Analysis
Introduction
Data visualization and analysis are a major part of my daily work. Often, I find myself switching between different programming languages and software just to complete a single task. While this is great for sharpening my skills, it can also be very time-consuming.
A few months ago, I started building a Windows application designed to streamline the entire workflow, from data cleaning to visualization, with just a simple data load. It’s definitely an ambitious project, so development will be ongoing, with new features added as the project evolves.
If you find this tool useful, feel free to leave a kudos! Here is the link GitHub.
Updates
I decided to host LLM models locally instead of using the GPT API for two main reasons: data privacy and token costs. The downside is that additional steps are required to load the models onto the local server, and the models themselves can be quite large—ranging from 3 GB to 110 GB.
Currently, due to memory limitations, I have to use a smaller model: deepseek-math-7b-instruct. However, its performance hasn’t met my expectations. After a few prompts, the model begins to show confusion.
Another issue is speed, as both prompts and responses are stored for history. These problems are demonstrated in the video.
My goal is to address these issues before feeding actual data into the prompts.
Features
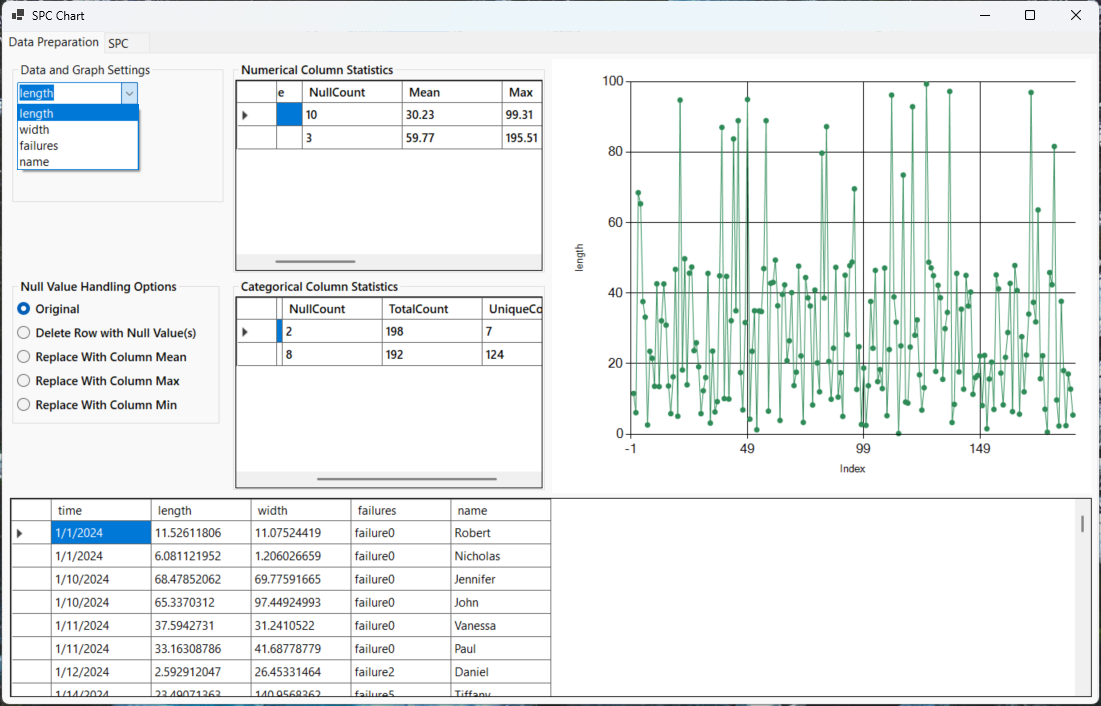
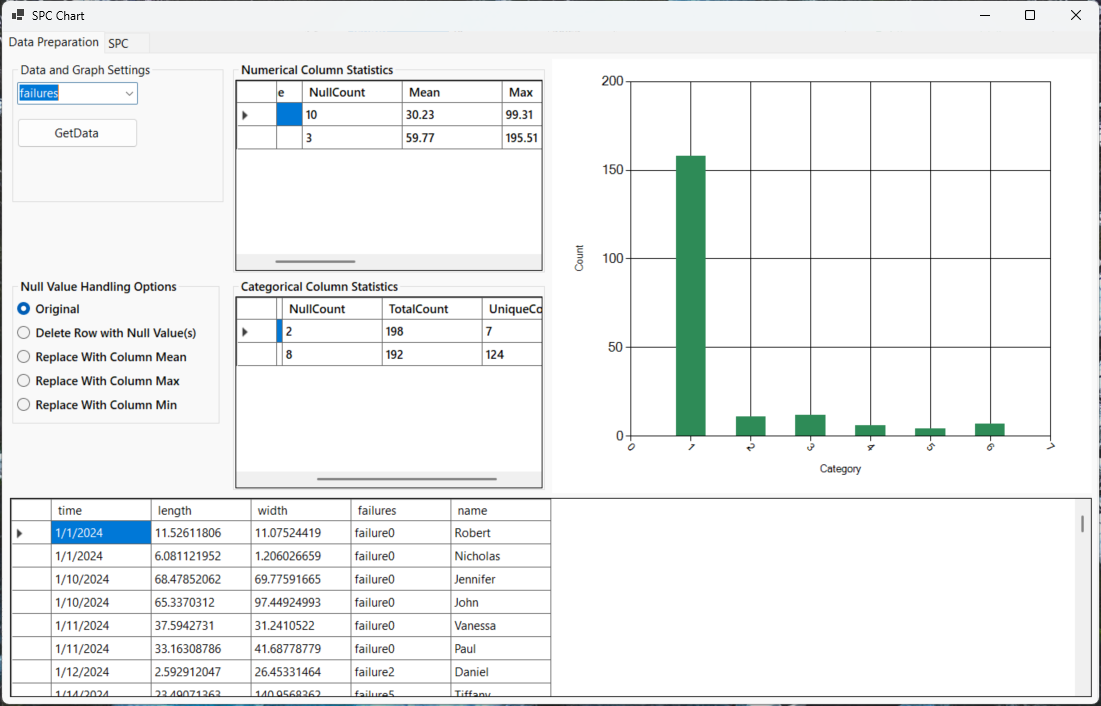
Upon loading, the program automatically detects the data type of each column and categorizes them accordingly. For numerical columns, it calculates the mean, standard deviation, minimum and maximum values, as well as the 25th, 50th (median), and 75th percentiles. For categorical columns, it computes the number of unique values and their frequencies.
The program also offers multiple options for handling null or missing values. It also automatically detects column names for plotting. For numerical columns, it generates a scatter-line combo chart, while for categorical columns, a bar chart is used.
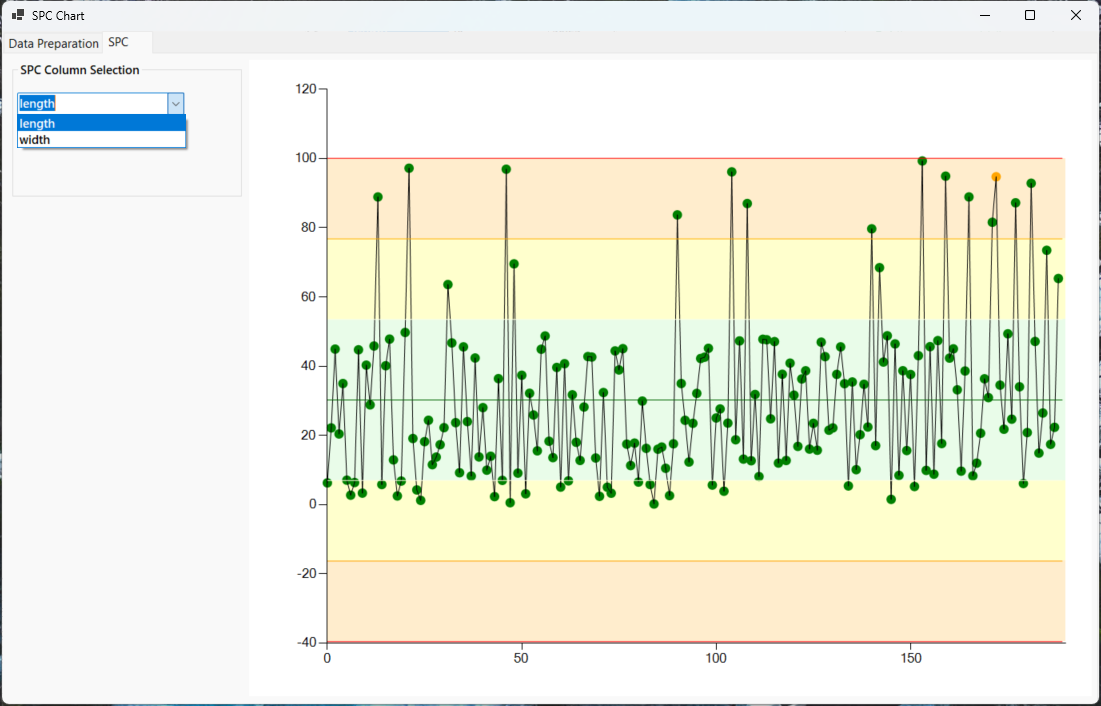
Currently, the primary feature available is the Statistical Process Control (SPC) chart. The program automatically performs calculations on numerical columns and generates SPC charts based on the Western Electric Rules. These rules are visually represented with color coding for easier interpretation.
Features To Come
The items below are features I am actively working on. Few free to reach out if you would like to collaborate!